Introduction
We talk about stellar activity a lot on this blog. Once HPF gets on sky, radial velocity noise from stellar activity will likely be the biggest impediment to finding exoplanets. Thus, if we want HPF’s chief scientific mission of discovering low-mass exoplanets to be successful, we have to be prepared to deal with stellar noise from Day 1 of our upcoming survey. In today’s post, we will look in detail at how the HPF team verified a set of near-infrared absorption lines from calcium as a first indicator of stellar magnetic activity for the HPF exoplanet survey.
Research led by HPF’s own Robert Marchwinski suggests that Doppler noise from stellar activity should actually be reduced at the near-infrared relative to the noise levels observed at visible-light wavelengths. However, “less” does not mean “none,” and we certainly do not want to find any unpleasant surprises! Following the examples of previous exoplanet surveys, we intend to track the magnetic activity of our target stars by monitoring the variability of atomic lines in the stellar spectra that change as magnetic activity increases and decreases on the stellar surface.
For HPF, this is potentially easier said than done. The near-infrared wavelength coverage of our instrument, while ideal for targeting the smallest, coolest nearby stars, excludes all of the well-characterized atomic lines that previous Doppler surveys have relied on to provide information about stellar activity. This is illustrated in the spectrum below.
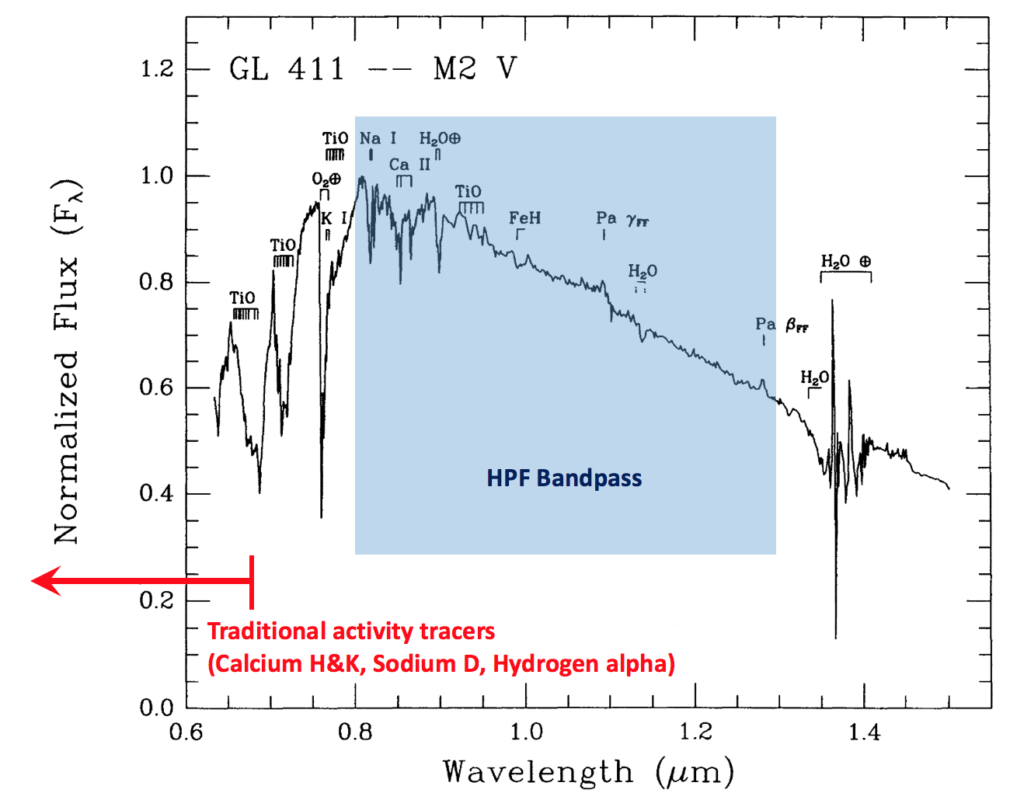
A near-infrared spectrum of Gliese 411, an M2 dwarf that is the sixth closest hydrogen-burning star to the Sun. Wavelength ranges for HPF’s coverage and the most commonly used activity indicators are shown. Adapted from Figure 2 of Kirkpatrick et al. (1993).
Therefore, if HPF is to confidently identify nearby exoplanets, we will have to establish at least one new atomic-line index to help us trace stellar magnetic activity. It would be nice to have this done before HPF goes on sky, but such an experiment is potentially a major undertaking. Ideally, one would like to use a high-resolution near-infrared spectrograph (of which there are few–hence we are building HPF!) to make many observations of one or more M dwarf stars (so we can see the activity changing).
Proxima to the Rescue
As it turns out, we can use some data that are already available to get started! More specifically, many observations have already been taken of our nearest stellar neighbor, Proxima Centauri. As we discussed on the last entry of the HPF blog, Proxima Centauri (Proxima for short) is a mid-M star that is about 4 light-years away from the Sun. Recently, Proxima was found to host a low-mass planet in its liquid-water habitable zone, making it an exciting target for future efforts to characterize the atmospheres of potentially Earthlike planets and to search for signatures of extraterrestrial life.
Proxima is also relatively active for an M star of its age. Indicators of magnetic activity in stars (brightness, spectral line variability, X-ray emission) show that Proxima varies on many timescales, from less than a day to several years. A team of astronomers using the MOST spacecraft to search for a transit of Proxima b have come up empty so far, but in doing so found that Proxima exhibits stellar flares upwards of 60 times a day! On the long-timescale end, other astronomers have found evidence that Proxima may have a long-term magnetic cycle like that of our own Sun.
In 2009, a team of astronomers used the high-resolution UVES spectrograph and the XMM-Newton spacecraft to observe Proxima intensely for three nights at both X-ray and optical/near-infrared wavelengths. Their goal was to obtain information about Proxima’s atmosphere and magnetic field at different levels of activity. Their data set includes hundreds of spectra of Proxima, and covers a significant amount of magnetic variability.
As it turns out, these observations are a great resource for us to study activity indicators for HPF! In particular, the UVES observations were made with a special setup of the spectrograph, where the resulting spectra started at the hydrogen alpha (H-alpha or  for short) line, and extended redward into the blue half of HPF’s wavelength coverage. As you may recall, is a well known and characterized indicator of magnetic activity in M dwarf stars, and was instrumental in helping our team separate real exoplanets from activity-induced false positives in the Gliese 581 system. So with these data, we can measure the variability of the line as the magnetic activity stimulates its emission, and look at how the near-infrared lines respond to the same activity. The most sensitive lines will be our activity tracers for HPF! The results of this experiment were just published by the HPF team in a research article, but let’s take a look at the main points.
Results
The UVES spectra include 8 near-infrared atomic lines that previous studies have shown are at least somewhat sensitive to stellar activity. These lines are produced by hydrogen, potassium, sodium, and calcium. For each of the 562 spectra, we measured the flux in these lines, and compared them to the flux in the line.
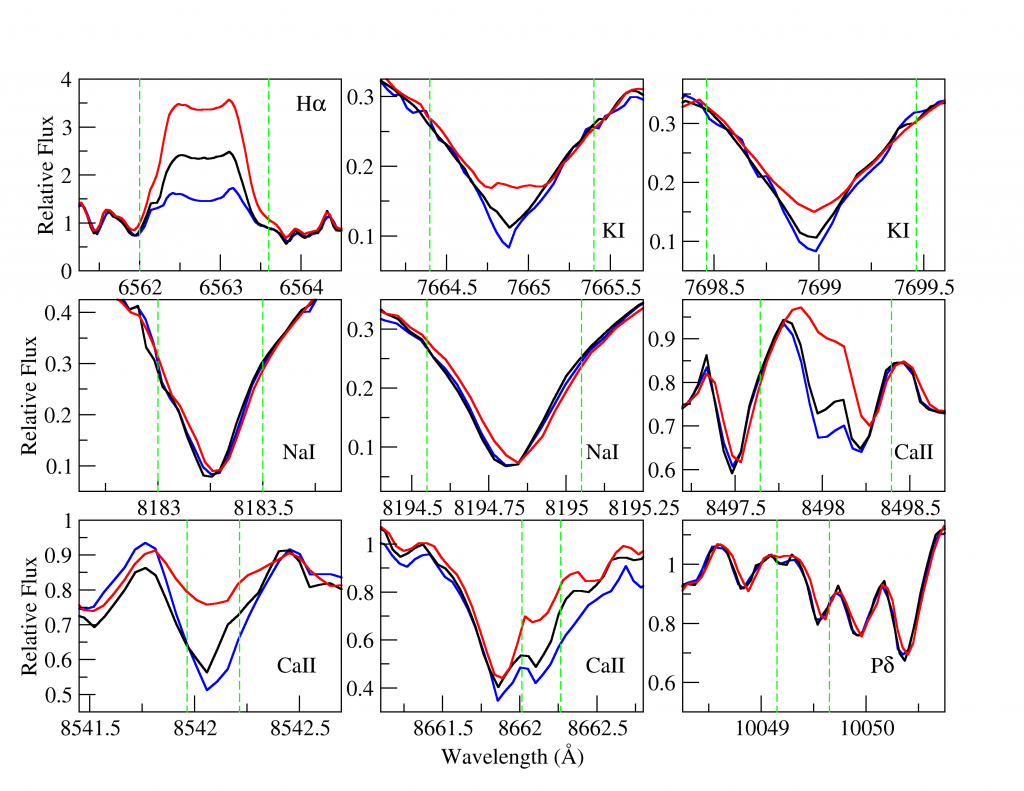
Examples of the near-infrared lines we considered as candidate indicators of stellar activity, with [latex]\textrm{H}\alpha[/latex] at top left for comparison. Each line is shown in its average state, and at periods of high (red) and low (blue) activity. The more activity-sensitive lines show a greater difference between high- and low-activity states.
In this experiment, the analysis was actually relatively simple. Two of the three calcium lines, and both of the potassium lines, matched the behavior of almost perfectly, while the sodium and hydrogen lines we considered were not nearly as useful. The third calcium line appears to be as sensitive as the first two, but it is contaminated by a nearby iron line, making its measurement less reliable.
The two bluest calcium lines will be excellent activity indicators for HPF, and will allow us to start separating signals from planets and activity from the very beginning of our survey. The potassium lines also look like great proxies for magnetic activity, but are just a bit too blue to be seen by HPF. However, there are other instruments in development that use what is sometimes called the “red-optical” wavelength range to look for exoplanets around slightly hotter M stars. These instruments include MAROON-X and Veloce, and the potassium lines may prove to be valuable tools for their surveys.
Concluding Thoughts
This study was an important reminder to keep an open mind when performing scientific experiments. At the outset, we were convinced that the near-infrared sodium lines would turn out to be the best activity indicators for HPF. The sodium lines are deep lines that are easily identified and measured for all M dwarfs, even in measurements of poor quality. Furthermore, the sodium lines at optical wavelengths are extremely sensitive to activity for M stars, leading us to expect similar results for their near-infrared counterparts. On the other hand, the near-infrared potassium lines are contaminated by absorption from Earth’s atmosphere, while two of the three calcium lines are much more difficult to identify than the other lines we considered. We were thus unconvinced that those lines would be of much use. As it turns out, the answer was exactly the opposite of what we expected! In sports, one would say “that’s why they play the game.” For us, perhaps the equivalent is “that’s why we do the experiment.”
There is certainly more work to be done for HPF. Our wavelength coverage will include wavelengths considerably redder than UVES can access, and there are additional lines we must investigate for activity sensitivity. Furthermore, it will be interesting to see how all of these candidate tracers behave for a variety of stars and magnetic phenomena. Nevertheless, it is reassuring to know that our toolbox will be at least partially filled when the survey starts.


 RSS - Posts