
The primary science goal of HPF is to find planets around mid-to-late M dwarfs using the radial velocity method. The largest of these are about a third the size of the Sun, and about 2/3rd as hot (~ 3000 K vs 5777 K for the Sun). To achieve this, we conduct routine and intensive observations of a small (carefully selected) group of such stars, one of which is the ‘ultracool-dwarf’ vB 10.
So what is vB 10?
Discovered in 1944 by van Biesbroeck (hence the ‘vB’ in vB 10), it was the faintest star known back then and was observed using photographic plates. Interestingly enough, vB 10 was discovered using observations from 2.1 m telescope at McDonald Observatory, which now also hosts the 10 m Hobby-Eberly Telescope where HPF is situated. It’s about a tenth the radius of the Sun, (in fact is closer to Jupiter in size), while being about half the temperature of the Sun at 2800 K. An M8 dwarf, it belongs to the category of objects referred to as ‘ultracool dwarfs’, and is pretty much the smallest star that can still fuse Hydrogen (1H) to Helium (stars less massive than M8 dwarfs are typically called brown dwarfs; Figure 1). Over the years, there have been numerous claims and dismissals (here and here) of planetary detection around vB 10, which pretty much rule out giant gaseous Jovian type planets around this star.
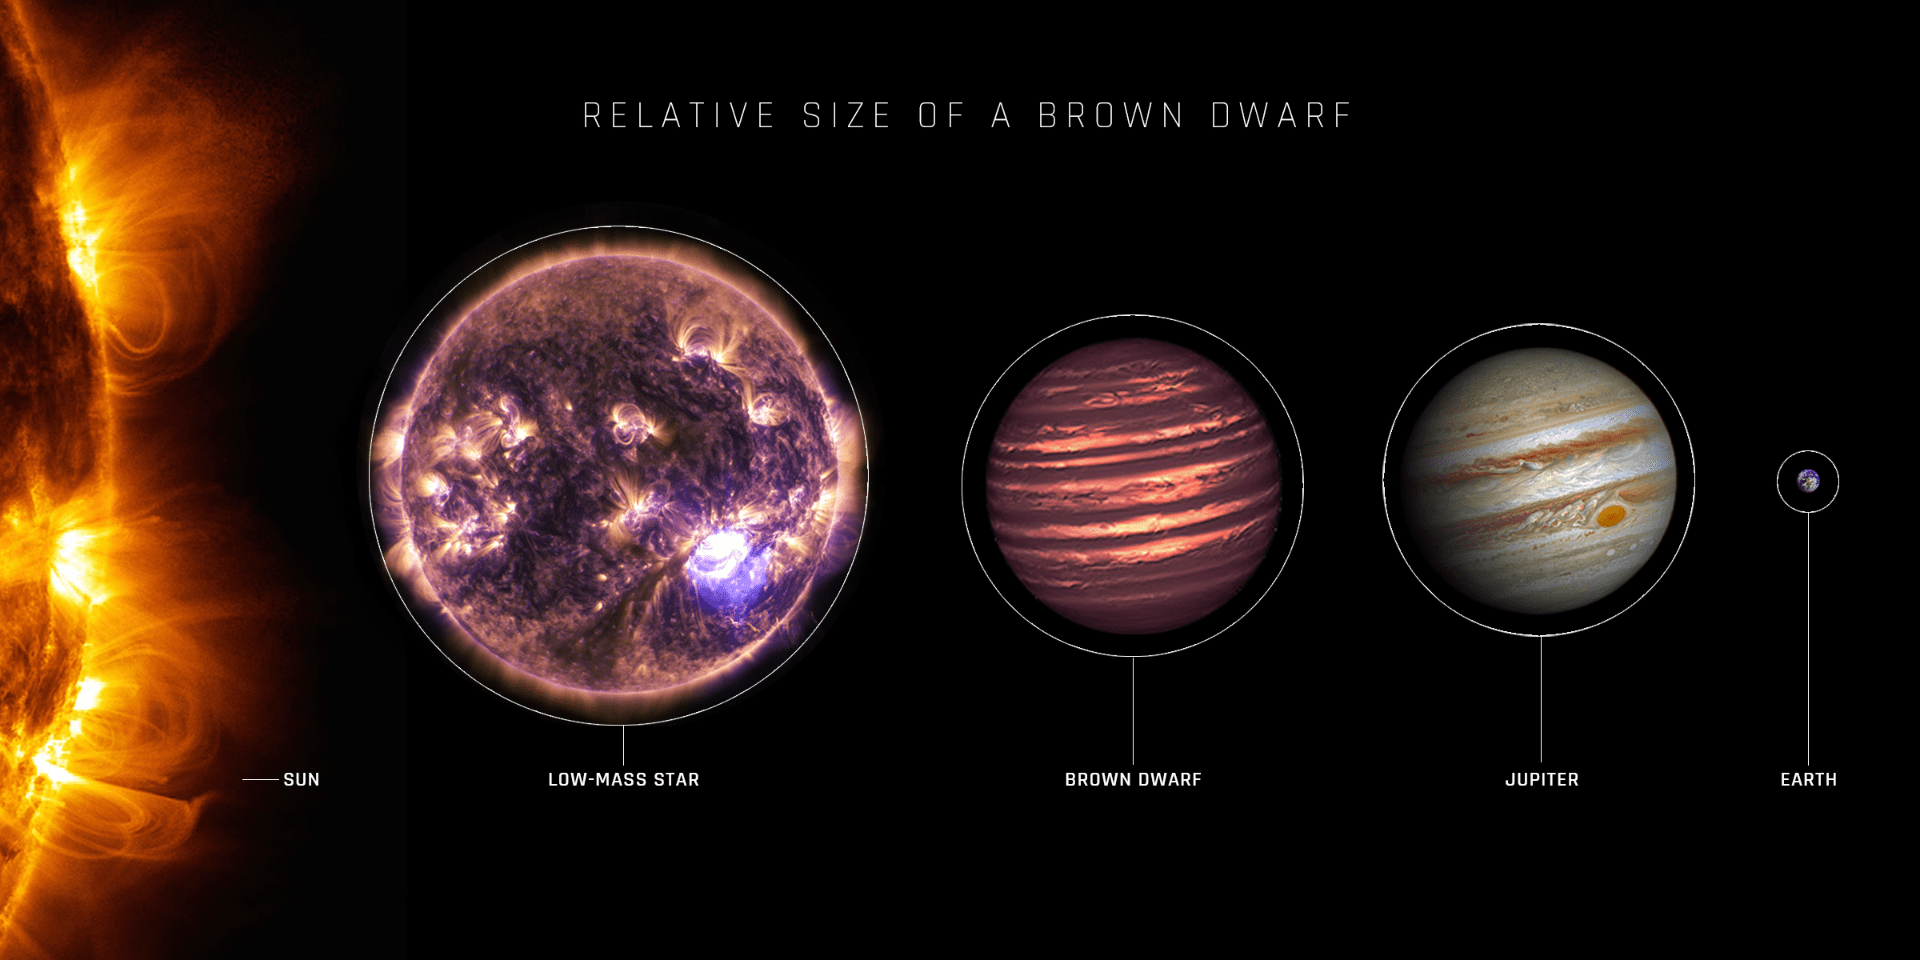
Figure 1: Size comparison of the Sun, low mass stars, brown dwarfs, and planetary bodies. Image Credit: STScI
What did we find with HPF?
With HPF’s near-infrared wavelength coverage, stable instrument, and HET’s large mirror, we are trying to find smaller planets around vB 10, which have so far been out of reach of the previous generations of planet-hunting instruments. Aside from obtaining precise radial velocity measurements of the star, these observations are also useful for serendipitous observations of transient phenomena. HPF observed vB 10 on 2019 August 20th at 05:40 (UTC), as part of its regular queue operations; subsequent analysis a couple months after revealed a huge flux increase (emission) in some of the atomic lines present in the near-infrared spectra (Figure 2). These are indicative of a stellar flare on vB 10, a phenomena that has been observed in the past (here, here and here).
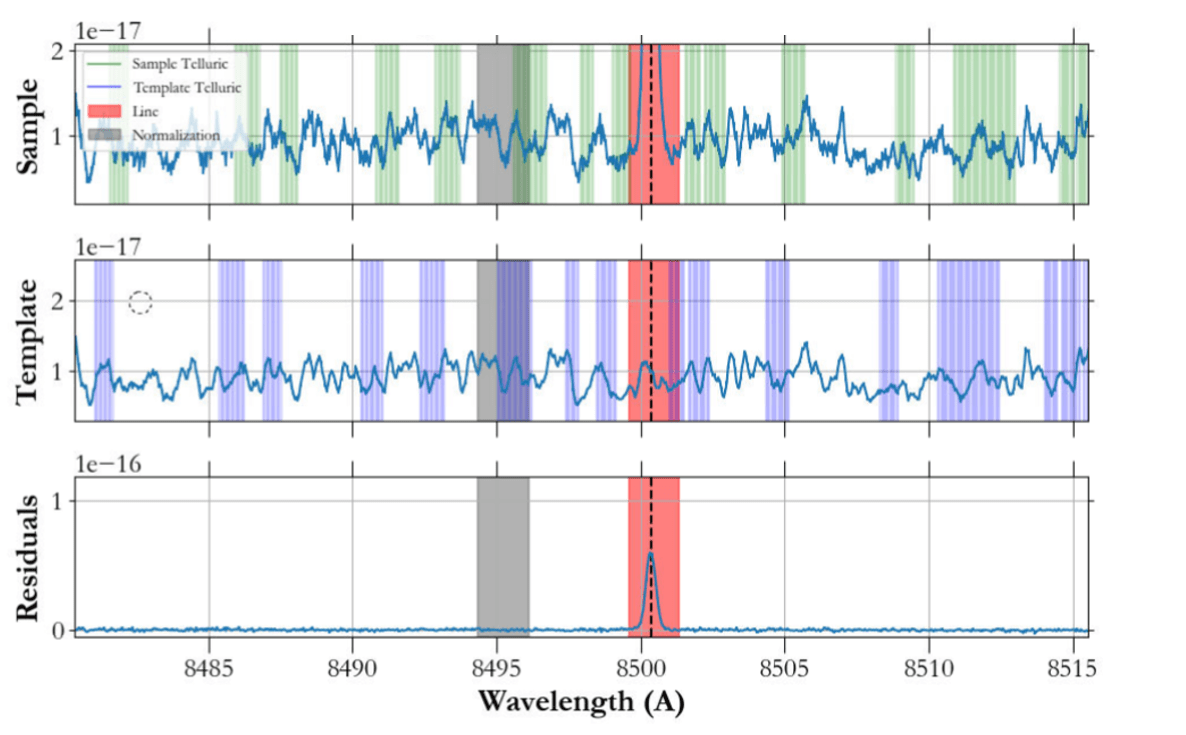
Figure 2: The top panel shows the excess flux at ~ 8500 Angstroms, which is a Calcium atomic transition, compared to the template (average) spectrum in the middle panel. The bottom panel shows the difference between the two, highlighting the excess flux that was measured on this date.
What are flares?
Stellar flares are short lived intense eruptions of energy on stellar surfaces, with their exact provenance not being completely understood. The current best hypothesis is that when a magnetic field lines (think of them as a tense and taut rubber band) on stellar surfaces rupture and reconnect, they release a LOT of magnetic potential energy. Some of this is converted to thermal energy, and generates very high temperatures, while the rest accelerates ions and electrons on the star to very fast speeds. Some of the gas at the site of magnetic reconnection rushes towards the surface of the star, and the rest is shot above the flare away from the stellar surface (Figure 4).
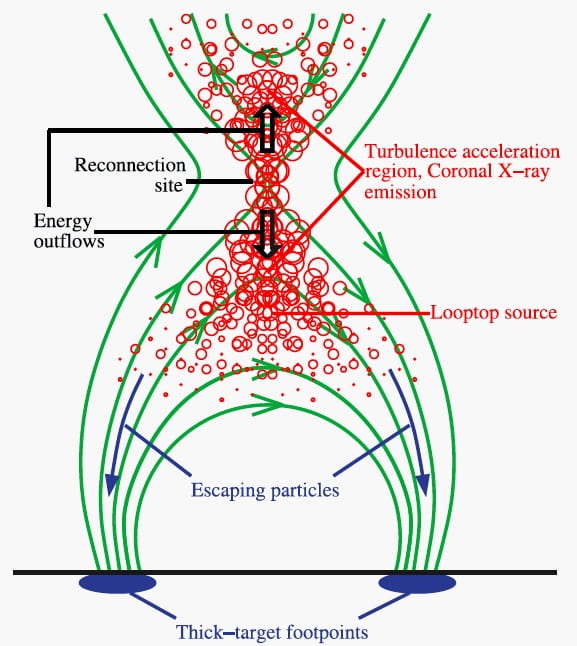
Figure 3: A schematic of a flare showing the magnetic field lines in green, and energy outflows. The red circles represent over-densities of plasma or hot gas caused by the release of energy at the reconnection site. Image Credit: Liu et al. (2008)
A Red Excess?
Apart from the Calcium lines, we observe a few different atoms that were excited enough (in a high energy state), that they displayed emission peaks. Specifically, with HPF we are able to observe the three atomic transitions (triplet) of Helium at about 10830 A (the same transitions which we use to detect escaping planetary atmospheres). These observations at wavelengths > 9000 A, are typically inaccessible for traditional optical, CCD based spectrographs. For example, we see that the Helium atomic lines (Figure 3), show excess flux similar to Calcium, Hydrogen, etc. However, we also find a red excess which cannot be explained by the atomic transitions.
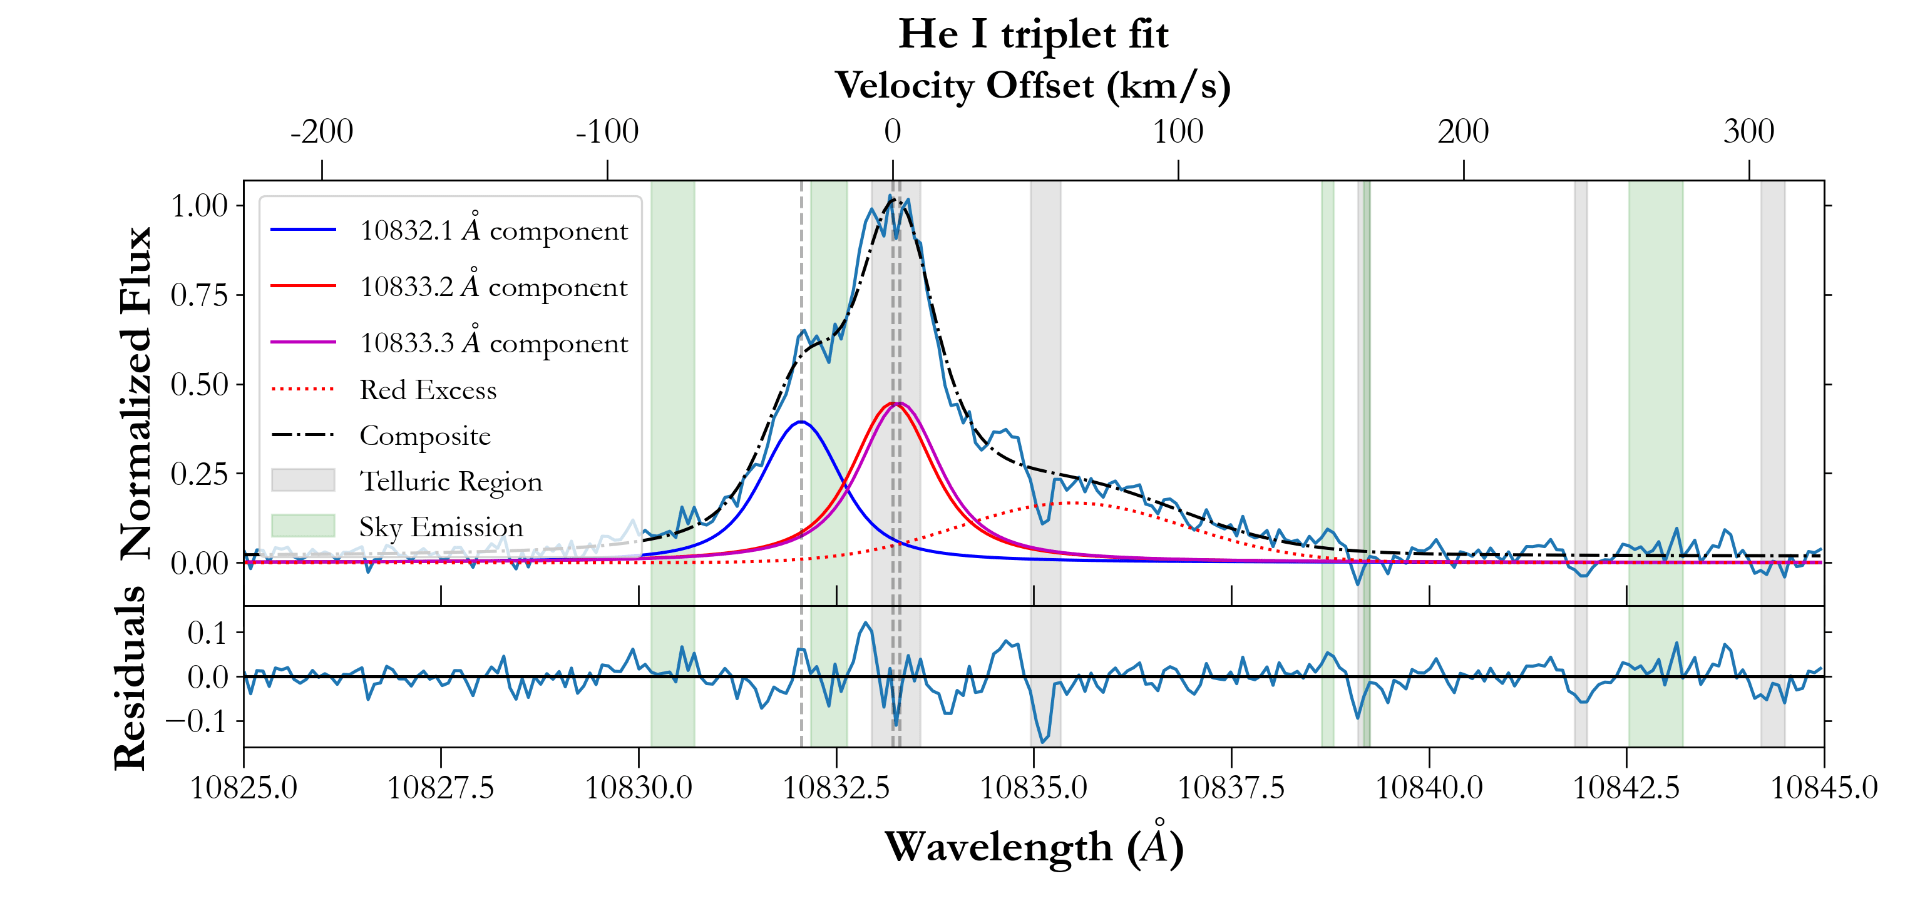
Figure 4. Emission flux observed in Helium, showing the positions of the triplet, as well as the peaks. When we fit a model to the Helium lines (shown in solid blue, red and purple), we see that it cannot reproduce an excess towards the redder wavelengths (dotted red).
What is coronal rain?
This excess has about 30% the flux of the main Helium lines, and is offset in wavelength by ~ 3 A, which corresponds to a velocity shift of 70 km/s (in other words, the Helium atoms that emitted the red feature were falling with a velocity of about 70 km/s towards the surface of the star). It is indicative of a phenomenon called coronal rain, which has been observed for the Sun (video below) for many decades.
While a fraction of the hot gas that is shot away from the star after the reconnection escapes the gravity of the star and is ejected out as a coronal mass ejections (CME), not all of it is hot enough (and hence moving fast enough) to escape the star. Some of it falls back to the star during the gradual phase, which occurs a while after the initial reconnection event (typically referred to as the impulse phase). This gas falling towards the surface of the star, is moving away from us (ignoring projection effects; this gas in our line of sight is between us and the star), and is therefore red-shifted compare to other atoms present in the stellar atmosphere. If it is hot and dense enough, it can emit light while falling towards the surface of the star. This is coronal rain is what we think is responsible for the red asymmetry we see in our Helium observations during the vB 10 flare — hot, dense blobs of gas that are falling towards the surface of the star, from high in the stellar atmosphere, after they got there typically due to the excess energy emitted during stellar flares. In the video below we see an actual resolved video of the Solar surface showing coronal rain with the hot blobs of gas falling towards the Sun along the curved magnetic lines.
Since we cannot resolve the surfaces of distant stars, studying these asymmetries in the atomic lines tells us about the movement of the atoms that were emitting the photons we detect. It helps us understand not just the composition of stars, but also their structure and velocity fields. While there have been previous observations of some early M dwarfs which allude red asymmetries to coronal rain, this is the first quantitative analysis for such a cool, late-type star, and also the first using the Helium atom as the indicator. All the clues suggest that it does rain on vB 10… (though not the kind of pleasant H20 rain we’re used to, but in the form of extremely hot blobs of gas at ~ 10,000 Kelvin).
Additionally we’re able to use images from the guide camera accompanying HPF observations to place limits on the total amount of energy emitted by the star during this flare, and also place limits on its duration and frequency. Thereby this work presents a unique combination of high resolution spectroscopy + photometry to study the interesting phenomenon of stellar flares, and the features accompanying them. You can read more about this in this recent research article by HPF team member Shubham Kanodia.
 RSS - Posts