
The Discovery
For the past four years alongside the HPF survey to discover new exoplanets, we have also been using HPF to follow-up on planet candidates discovered by NASA’s Transiting Exoplanet Survey Satellite (TESS) mission. The TESS survey is observing the entire sky every two years, and has already found thousands of planet candidates, many of which orbit M-dwarfs. By observing millions of M-dwarfs, it is able to find giant transiting exoplanets (six times Earth’s radius or larger) around M-dwarf stars, which are supposed to be quite rare. The impact of this mission on our sample of these planets can be seen below, where up until 2018 we knew of just four of these planets, while there are now around 15 of them.

Discovery of confirmed giant transiting exoplanets orbiting M-dwarfs. The huge impact of TESS and our follow-up efforts utilizing HPF and NEID can be seen with the increase in discoveries post 2019.
TOI-5205
As part of these follow-up efforts, we began observing one of these planet candidates–TOI-5205 b–with HPF and other ground-based observing resources. This candidate seemed particularly interesting since it orbits a mid-M dwarf that is just about 40% the size and mass of the Sun, and about 3400 K in temperature (compared to the 5800 K for the Sun). This is an especially small host star when compared to all the previous giant Jupiter-sized planets, which were found around early M-dwarfs (roughly 60% Solar mass and 4000 K in temperature).
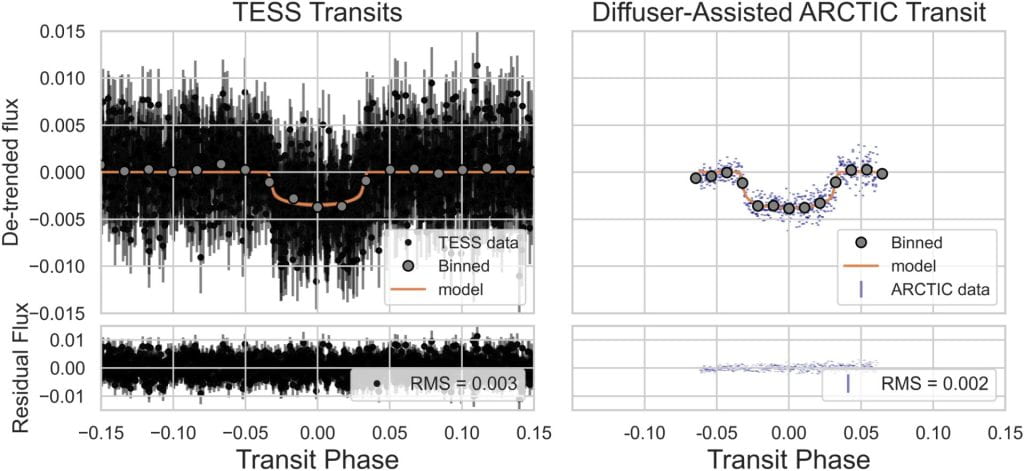
We started the characterization of this planet candidate with ground-based transits from a multitude of telescopes, including the 3.5-meter ARC telescope (ARCTIC) at Apache-Point Observatory, USA, 0.6 m Red Buttes Observatory (RBO) in Wyoming, USA, and 0.3 m TMMT telescope in Las Campanas, Chile. This was important because the host-star (TOI-5205) had another star present about 0.1% of a degree away on the sky, which contaminates the low-resolution TESS images. These ground-based transits helped us estimate the level of this contamination and also refine the transit timing for the planet.

Different ground-based photometry obtained for TOI-5205 b. The transit models in red were not used for obtain the transit depth due to various systematics, but just to refine the transit timing.
The first of these transits on April 22, 2022 with APO confirmed that the initial contamination efforts were close, and we did indeed have a massive Jupiter-sized object orbiting a mid-M dwarf. This transit, at nearly 7% brightness reduction, is one of the deepest known transits for exoplanets orbiting main-sequence stars!
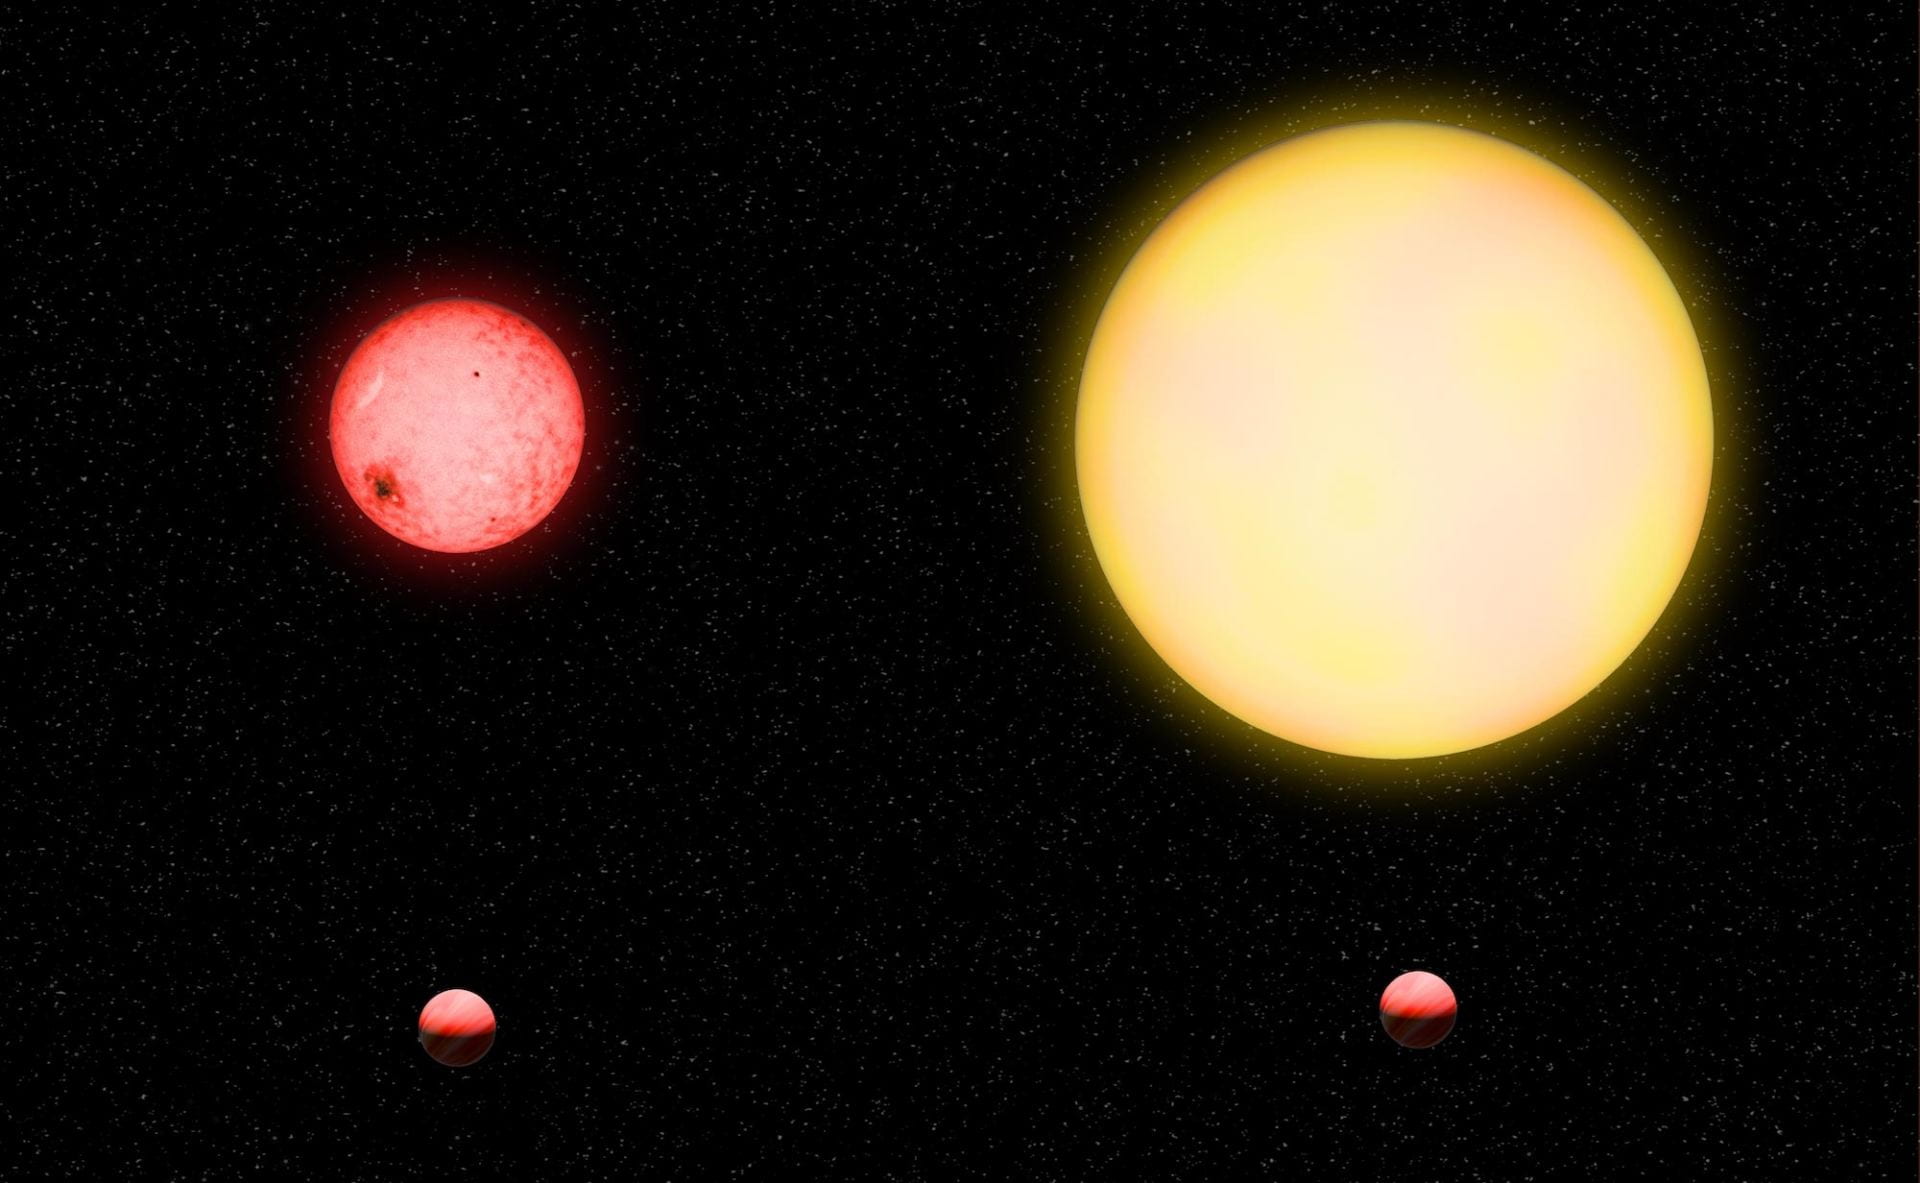
Artist rendition showing the relative size of the TOI-5205 b system compared to similar Jupiter-like planets around Solar-type stars (Credit: Katherine Cain, Carnegie)
Subsequently we obtained seven HPF radial velocities (RV), which helped us estimate the mass of this object to be planetary in nature, and in fact almost exactly that of Jupiter (~ 1.08 Jupiter masses). TOI-5205~b turned out to be the first confirmed Jupiter-type planet such a low-mass star. The ratio of the planet’s mass to that of the star is about 0.3%, which one of the largest for all M-dwarf planets.
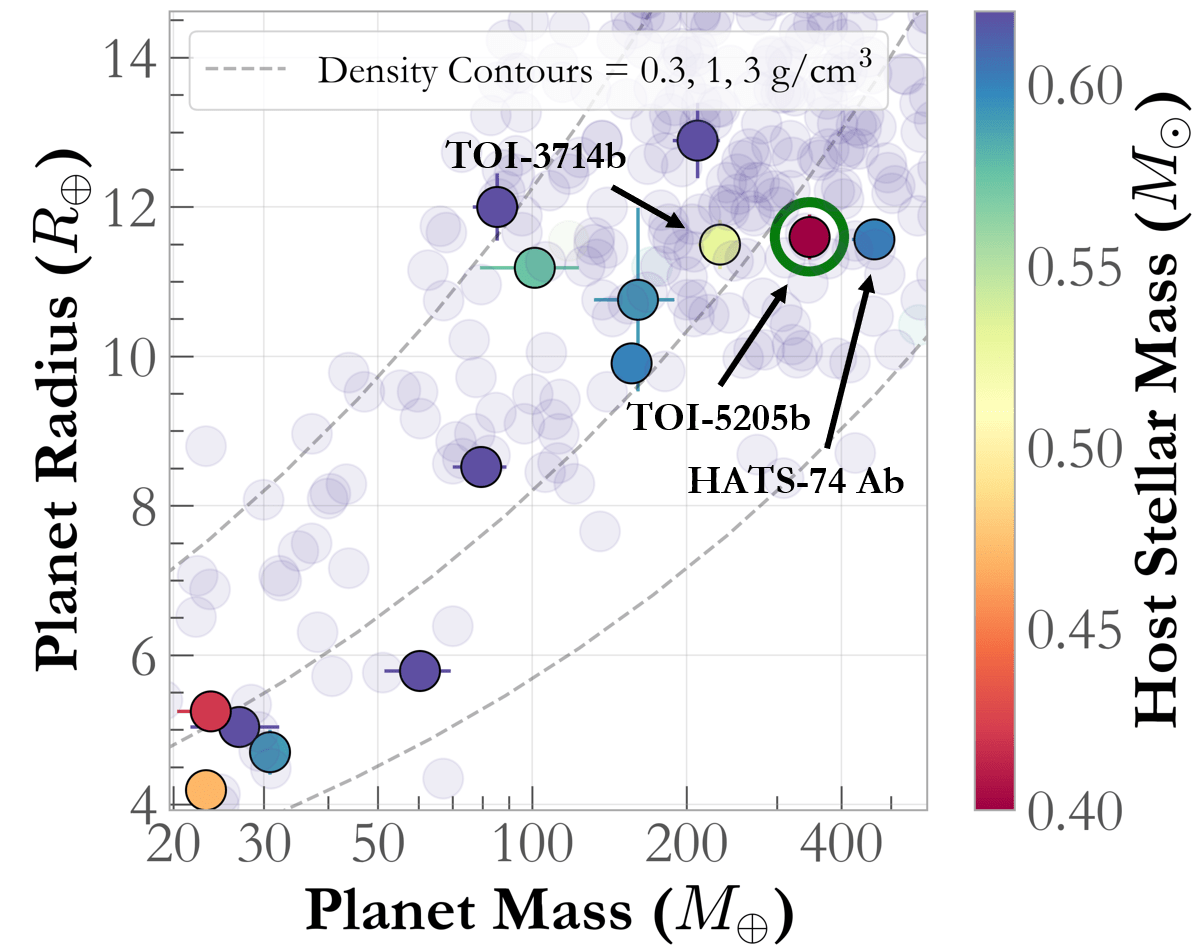
TOI-5205 b with respect to the other massive planets orbiting M-dwarfs. Its red marker shows how its host star is much lower in mass compared to the other similar systems.
So why is TOI-5205 b forbidden?
Core Accretion
For context, a 0.3% mass ratio object around a Solar-type star would have a mass of about 3 Jupiter masses; at these masses, the conventional core-accretion theories of planet formation start to have a harder time to form these objects. Under this core-accretion paradigm, planets must first form a solid core that’s primarily made of heavy elements (not hydrogen/helium) and roughly 10 Earth masses. Once it reaches this threshold, the planet undergoes a runaway process of gas accretion where it quickly builds up a massive gaseous envelope reaching Jupiter in size and mass (see here for a review).
So far all the Jupiter-like planets have been around early M-dwarfs, where the primary challenge has been forming this initial heavy-element core before the protoplanetary disks in which these planets form evaporate away. This was first shown by the seminal papers from Gregory Laughlin, and also Ida & Lin, which suggested that these low-mass stars would struggle to form these massive-enough cores in a timely fashion before the disk vanishes because the host-star is lower in mass (flashback to Kepler’s third law, where the orbital period is inversely proportional to the host-star mass). One way around this was the idea of gravitational instabilities in turbulent disks forming planets.
Gravitational Instability
Under the gravitational instability scenario proposed by Alan Boss, massive disks (typically assumed to be > 10% the mass of the host-star) tend to form self-gravitating clumps of dust and gas far away from their host star where the disk is quite cool. These clumps start off in spiral arms (similar to the spiral arms of the Milky Way Galaxy), and eventually coalesce to form planets. The main reason this presents a viable alternative to core-accretion is that this is a very fast process, where planets can form quickly in a few thousand years (as opposed to the millions of years it takes through core-accretion).
However, the problem for TOI-5205 b orbiting a mid-M dwarf is not just about the timescale of formation in the protoplanetary disks, but more of mass budgets.
Mass Budgets
It is typically assumed that planet formation begins in Class II protoplanetary disks which are about 1 – 10 million years old. These disks can now be studied with facilities like the Atacama Large Millimeter/sub-millimeter Array (ALMA) in the Atacama Desert, Chile which consists of 66 individual radio telescopes, and enable estimates of the amount of dust and gas present in a star’s protoplanetary disk.
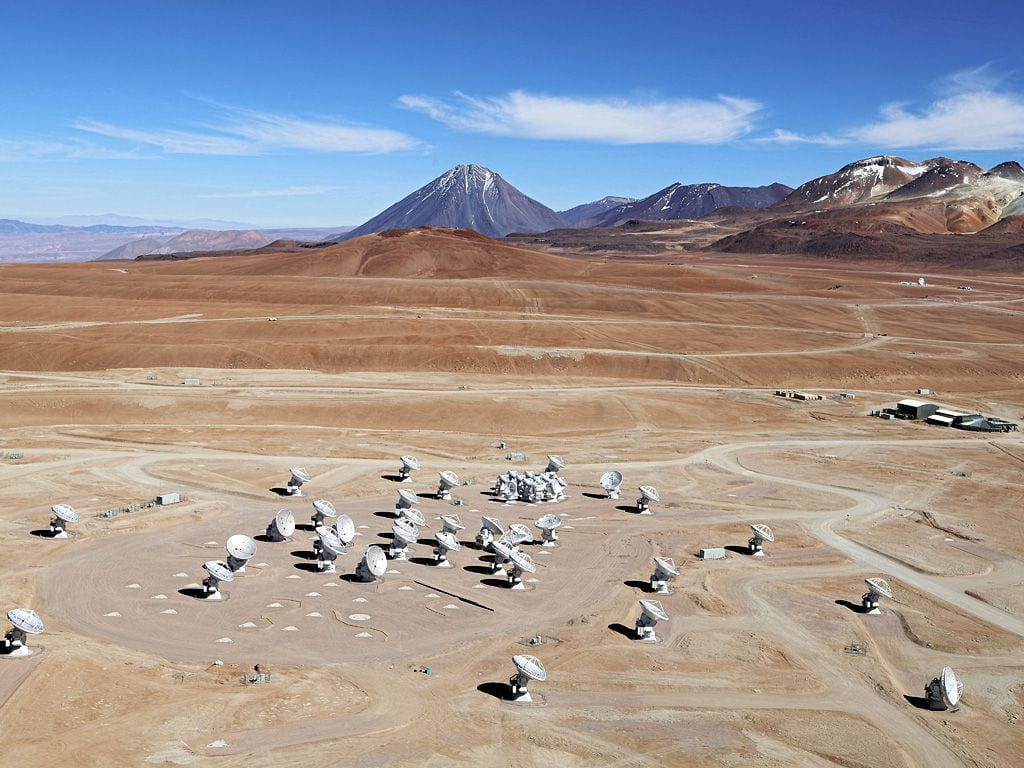
ALMA: Large array of radio telescopes in Chile (Credit: ESO)
Studies of disks suggest that they tend to be quite diverse in their properties, while also following an approximate relation where the disk masses are proportional to the host-star mass. For stars similar to TOI-5205, these relations suggest that they have about 10 Earth masses of dust (here and here), albeit with a large spread in the predictions from these measurements.
For comparison, models of planetary interiors utilize our understanding of how gases and metals react to high temperatures and pressures to estimate what the interiors of these planets look like (here). Put simply, based on the planet’s mass, radius, temperature, etc., they can predict how much metal (or non hydrogen/helium heavy elements) they have. These models also have a large scatter in their predictions, but on average suggest that a planet such as TOI-5205 b should have about 60 Earth masses of heavy elements inside it.
And herein lies the problem: even if the entire protoplanetary disk collapsed to form one big ball of heavy elements, it still falls short by about a factor of 5! That being said, we know that TOI-5205 b exists, therefore there is some gap in our understanding of these disks, or planetary interiors, or the process of planet formation (or the most likely scenario, all of the above!).
Possible Solutions
There is the possibility that the ALMA observations are underestimating the disk dust masses, and that these disks indeed have a lot more dust in them. A few studies have shown that this might be the case, especially if the dust is locked up in particles that are larger than the millimeter regions probed by ALMA (see here for a review). If this were the case, then there would be a lot more material available to form these massive planets, which would help resolve the discrepancy presented above.
Furthermore, studies have suggested that planet formation is already underway for Class II disks, especially when it comes to giant planets. This implies that the total mass budget available for forming planets is not what is observed by ALMA for such disks, but perhaps much earlier during their Class 0 or I phase, when the disks are more massive by almost an order of magnitude!
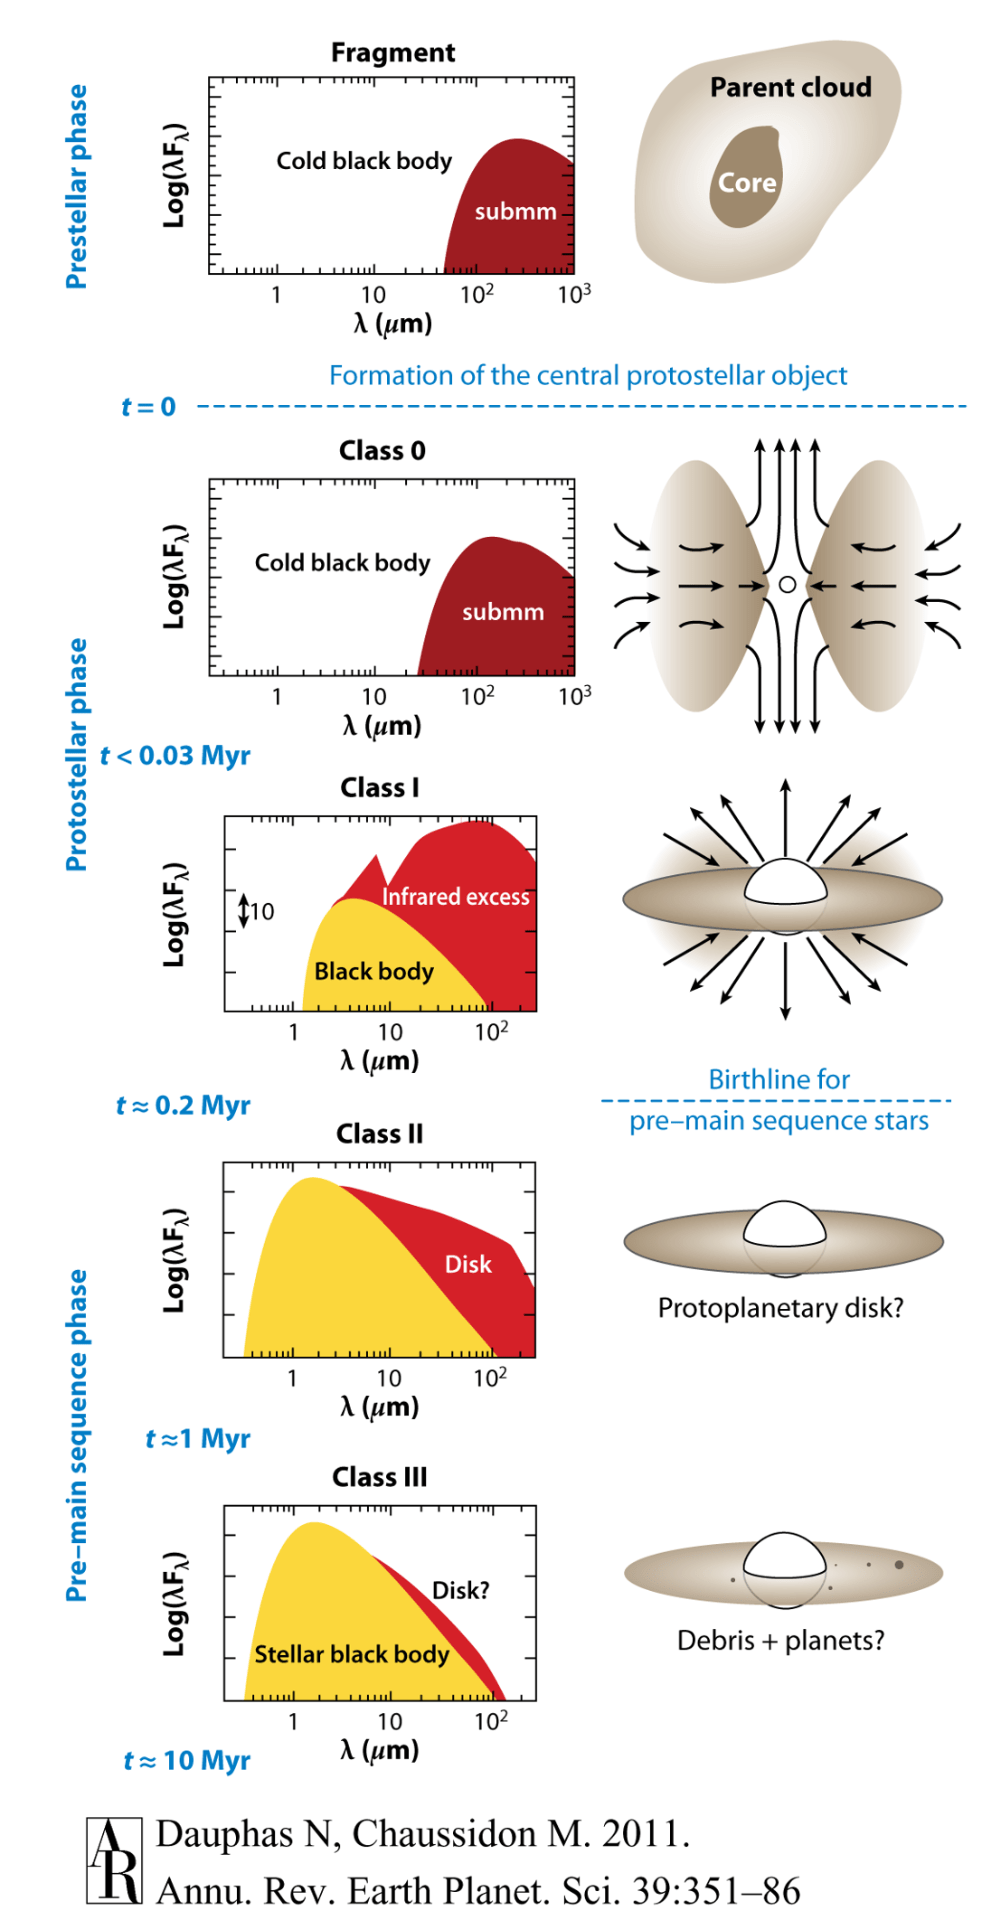
The evolution of protoplanetary disks. Typical observations with ALMA are during the Class II phase. However, it is now starting to be established that planet formation begins much earlier.
Lastly, some of the assumptions made by some of these planetary interior models have not stood the test of time. Recent observations of the Solar-system giant planets with the Juno and Cassini missions have shown that their interiors are quite complex, with diffused cores where the helium and metals are immiscible in metallic hydrogen (see here and here for a review). If this were true for giant extrasolar planets as well, then these models would be overestimating their heavy-element content.
Conclusion
The existence of TOI-5205 b can perhaps be attributed to a combination of factors suggested above, which suggest the need for revisions in our understanding of protoplanetary disks, planet formation, and also planet interiors. Follow-up efforts such as those conducted by HPF for Giant Exoplanets around M-dwarf Stars (GEMS) are already hinting at the presence of more such planets, which suggests that TOI-5205 b–while definitely an outlier–isn’t the only one. If so, how frequently do these forbidden planets form?
You can read more about this intriguing system in this manuscript from HPF team member Shubham Kanodia.
 RSS - Posts